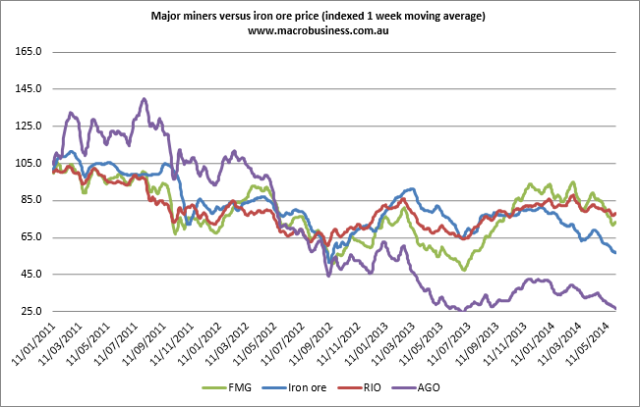
Iron Ore is falling, falling hard, and according to Macrobusiness “FMG and RIO both continue to hold up better than they should, down 2.2% to $4.44 and 1% to $59.48 respectively, but both are still above the lows of the past few weeks despite the iron ore price being materially lower” while “Miners are down across the board. AGO has well and truly taken out terminal support at 75 cents, last at 70 cents.”
Below from Macrobusiness is a relative performance chart:
So, what to expect from here?
From The Australian “Iron managing director Ken Brinsden said despite the iron ore price cooling on the back of increased supply in the market he was optimistic because the demand side did not look as if it had materially changed.
“The supply side has absolutely increased and it will take some time for those tonnes to find their natural home,” he said.
“But I firmly believe they will displace some other high-cost production in which case the buying tension re-emerges.”
Mr Brinsden said while anyone expecting the price to go back to $US150 a tonne would be disappointed, he believed there was a good chance the price could stay in the range of $US100- $US125 for years to come. “Our challenge as a business is to take advantage of our good assets in the ground, our good people, make sure we look after our cost base and that we’ve got a healthy balance sheet so we can weather the storm and come out the other side,” he said.”
And what does this mean for investors? Well according to Business Spectator‘s Value Investor ”
We can see that BHP Billiton, Rio Tinto, Fortescue Metals and Brazil’s Vale are at the lower end of the global cost curve and are well-positioned, as they remain profitable down to $50-60/tonne.
Meanwhile, mid-cap mining companies such as Mt Gibson and Atlas, may face problems, should the iron ore prices fall further, given they are higher up the cost curve with a breakeven price of around $80/tonne. Generally, these companies came into existence due to the historically high iron ore prices over the last seven years. While they currently remain profitable, were the price to fall towards $80, they would struggle to break even.
Mid-cap miners also tend to mine lower-quality iron ore and cannot charge as much in the first place. Their cost base is higher due to their smaller size and they do not possess the same economies of scale as the larger miners.
It’s important to understand that none of the iron ore producers, with the exception of BHP Billiton due to its diversification, are suitable as long-term investments – unless you have a matching long-term bullish view on iron ore. Nearly all of them are cyclical trading stocks only, best bought during fear and pessimism and sold at premiums to value during optimistic times.”


